|
Data management/Exploration &
description |
||
|
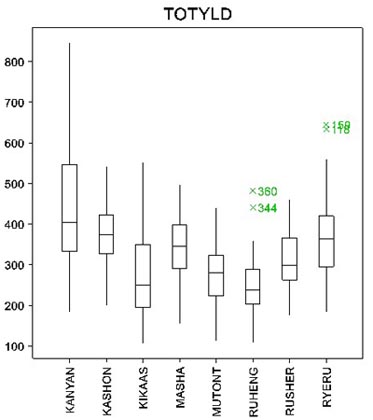
The next diagram shows a series of box plots by herd group obtained by using the 'Single variate with groups' option in the Boxplot command. Now we see that the number of outliers has been reduced to just four. We do not need to be unduly concerned about these as these will be some of the elite cows that we are looking for anyway. |
|
|
![]()
![]()
![]()